Please Login or Register to see Zip Code Report
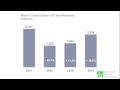
March 2011 Real Estate Market Statistics for
Washington, DC
RBI Sign In
| Statistic | Values | YoY | MoM |
|---|---|---|---|
| Total Sold Dollar Volume | $280,279,165 | +3.64% | +63.25% |
| Closed Sales | 555 | -3.81% | +50.41% |
| Median Sold Price | $379,950 | +7.33% | +5.54% |
| Avg Sold Price | $505,008 | +7.75% | +8.54% |
| Avg Days on Market | 83 days | -1.19% | -9.78% |
| Avg Sold to Orig List Ratio | 93.7% | +0.83% | +1.43% |
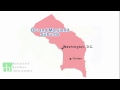
See maps to visualize ZIP Code trends
Embed auto-updated charts
March 2011 Summary:
Please log in to see these charts:
Don't have an account?
RBI Reports
Collection of Stats. Print them. Pass them on.
Don't have time to grab and share individual charts? Looking for an all-encompassing view of important charts and market indicators? We've done the legwork to compile priority and summary charts in one place. Continue looking at this space as we build out our inventory of reports, in the meantime we hope that you'll find the following reports to be valuable.
Washington, D.C. Reports

Detailed Report
The Detail Report is updated monthly. It includes marketing statistics, sales summary and detail information along with inventory, days on market and active listings. Sold and active detail is broken down at the "Attached" and "Detached" residency level.
See Most Recent
Summary Report
The Summary Report is updated monthly. The report includes monthly sales summary data and activity information comparing YoY and year to current date. This report also includes information on inventory, median sales price, days on market and % of OLP at sale.
See Most RecentWashington Zip Code Reports
- 20055 Washington
- 20060 Washington
- 20207 Washington
- 20303 Washington
- 20307 Washington
- 20390 Washington
- 20393 Washington
- 20001 Howard U./Shaw
- 20002 Capitol Hill/North
- 20003 Capitol Hill/South